StatsNotebook
Multiple Imputation
Tags: Analysis, R code, Missing data
Follow our Facebook page or our developer’s Twitter for more tutorials and future updates.
The tutorial is based on R and StatsNotebook, a graphical interface for R.
Missing data is a norm rather than an exception in most areas of research. Excluding observations with missing data reduces statistical power and potentially introduces bias in model estimates. Multiple imputation is a technique that fills in missing values based on the available data. It can increase statistical power and reduce the bias due to missing data.
StatsNotebook provides a simple interface for multiple imputation using the mice package. By default, numeric variables are imputed using predictive mean matching and categorical variables are imputed using multinomial logistic regression (for categorical variables with 3 or more level) or binary logistic regression (for categorical variables with 2 levels).
In this tutorial, we will use the built-in substance dataset. This dataset can be loaded into StatsNotebook using the instructions here. It is a simulated dataset on the effects of a family intervention during adolescence on engagement with deviant peer group, experimentation with drugs and risk of substance use disorder in young adulthood. See Causal Mediation Analysis for an example based on this dataset.
In this dataset,
- dev_peer represents engagement with deviant peer groups and it was coded as “0: No” and “1: Yes”;
- sub_exp represents experimentation with drugs and it was coded as “0: No” and “1: Yes”;
- fam_int represents participation in family intervention during adolescence and it was coded as “0: No” and “1: Yes”;
- sub_disorder represents diagnosis of substance use disorder in young adulthood and it was coded as “0: No: and “1: Yes”.
- conflict represents level of family conflict. It will be used as a covariate in this analysis.
This dataset can also be loaded using the following codes
library(tidyverse)
currentDataset <- read_csv("https://statsnotebook.io/blog/data_management/example_data/personality.csv")
Two variables, .imp and .id will be added to the dataset on successful imputation. The .imp is the imputation number, and zero indicates the original dataset. The .id is a unique identifier for each observation in the dataset.
Using StatsNotebook
Prior to imputing missing data, all categorical variables will need to be specified as categorical (i.e. factor variable in R). See Converting variable type for a step-by-step guide.
To impute missing data,
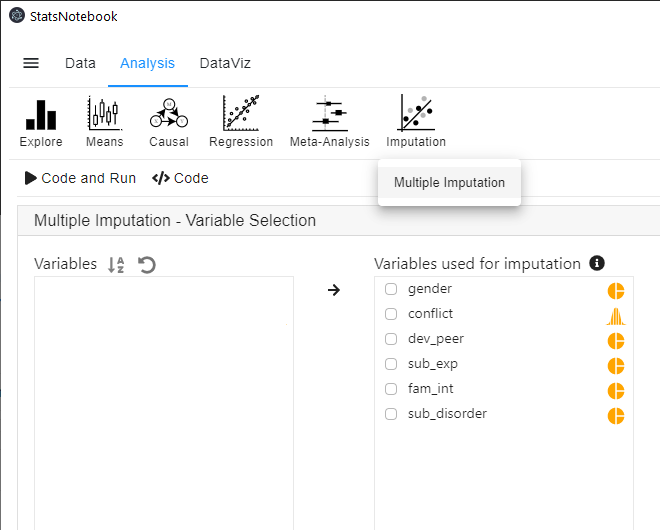
- Click Analysis at the top
- Click Imputation and select Multiple imputation from the menu
- In the left panel, select all variables that we want to include in our imputation. Variables with no missing data can also be included as information from these variables will be used to impute missing data in other variables.

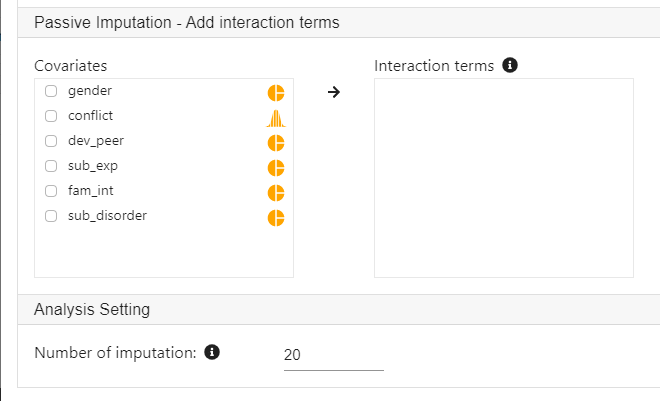
- Expand the panel Passive imputation if we need to include interaction terms in the imputation. In this example, we do not include any interaction.
- Expand the panel Analysis Setting to specify the number of imputations.
- As a rule of thumb, the number of imputations should be roughly similar to the percentage of missing data in the dataset.

Interpretaion
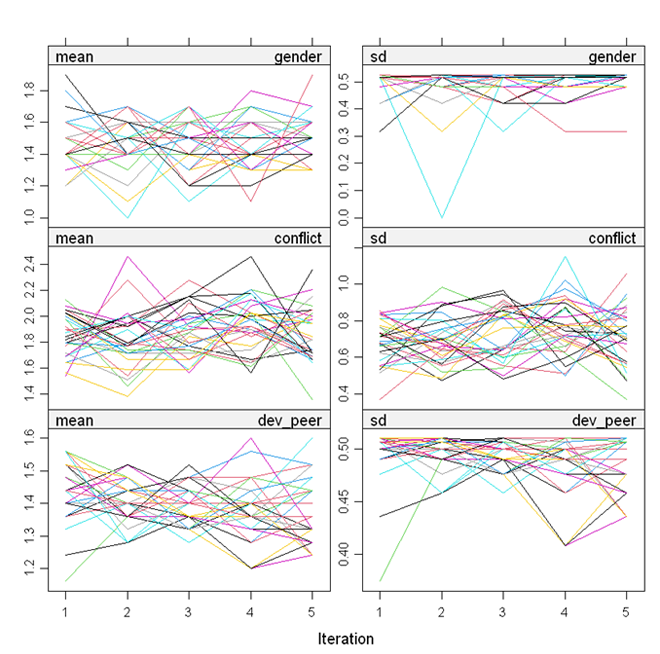
The only output from StatsNotebook is a set of diagnostic plots from the imputation model. The lines in all plots should be freely intermingled. Non-convergence will be indicated by clearly separated lines.

R codes explained
The following is the code generated by StatsNotebook.
library(mice)

formulas <- make.formulas(currentDataset)

formulas$gender =gender ~ conflict + dev_peer + sub_exp + fam_int + sub_disorder
formulas$conflict =conflict ~ gender + dev_peer + sub_exp + fam_int + sub_disorder
formulas$dev_peer =dev_peer ~ gender + conflict + sub_exp + fam_int + sub_disorder
formulas$sub_exp =sub_exp ~ gender + conflict + dev_peer + fam_int + sub_disorder
formulas$fam_int =fam_int ~ gender + conflict + dev_peer + sub_exp + sub_disorder
formulas$sub_disorder =sub_disorder ~ gender + conflict + dev_peer + sub_exp + fam_int

meth <- make.method(currentDataset)


imputedDataset <- parlmice(currentDataset,
  method = meth,
  formulas = formulas,
  m = 20,
  n.core = 15,
  n.imp.core = 2)

plot(imputedDataset)
currentDataset <- complete(imputedDataset, action = "long", include = TRUE)
"Chan, G. and StatsNotebook Team (2020). StatsNotebook. (Version 0.1.0) [Computer Software]. Retrieved from https://www.statsnotebook.io"
"R Core Team (2020). The R Project for Statistical Computing. [Computer software]. Retrieved from https://r-project.org"
"Buuren, S. v. and K. Groothuis-Oudshoorn (2010). mice: Multivariate imputation by chained equations in R. Journal of Statistical Software: 1-68."
The top section specifies how each variable is imputed. StatsNotebook will use all selected variables for imputation.
formulas <- make.formulas(currentDataset)

formulas$gender =gender ~ conflict + dev_peer + sub_exp + fam_int + sub_disorder
formulas$conflict =conflict ~ gender + dev_peer + sub_exp + fam_int + sub_disorder
formulas$dev_peer =dev_peer ~ gender + conflict + sub_exp + fam_int + sub_disorder
formulas$sub_exp =sub_exp ~ gender + conflict + dev_peer + fam_int + sub_disorder
formulas$fam_int =fam_int ~ gender + conflict + dev_peer + sub_exp + sub_disorder
formulas$sub_disorder =sub_disorder ~ gender + conflict + dev_peer + sub_exp + fam_int
After specifying what variables would be used to impute each of the variables, we use the following line of code to specify the imputation methods. By default, predictive mean matching will be used for numeric variables, binary logistic regression will be used for dichotomized variable and multinomial logistic regression will be used for categorical variables with two or more levels.
meth <- make.method(currentDataset)
After the setup, the function parlmice will be used to impute missing data.
imputedDataset <- parlmice(currentDataset,
  method = meth,
  formulas = formulas,
  m = 20,
  n.core = 15,
  n.imp.core = 2)
Citations
Chan, G. and StatsNotebook Team (2020). StatsNotebook. (Version 0.1.0) [Computer Software]. Retrieved from https://www.statsnotebook.io
R Core Team (2020). The R Project for Statistical Computing. [Computer software]. Retrieved from https://r-project.org
Buuren, S. v. and K. Groothuis-Oudshoorn (2010). mice: Multivariate imputation by chained equations in R. Journal of Statistical Software: 1-68.
Follow our Facebook page or our developer’s Twitter for more tutorials and future updates.