DataViz
Follow our Facebook page or our developer’s Twitter for more tutorials and future updates
DataViz in StatsNotebook is largely based on ggplot2. Publication ready plots and figures are just a few clicks away.
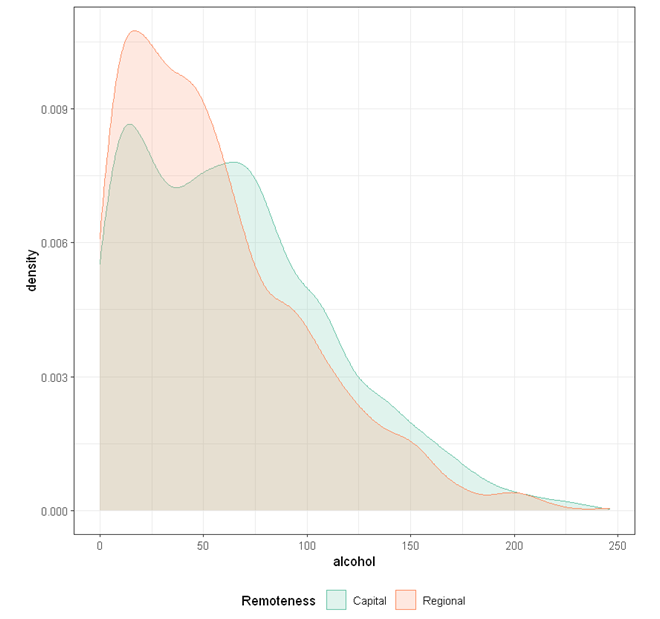
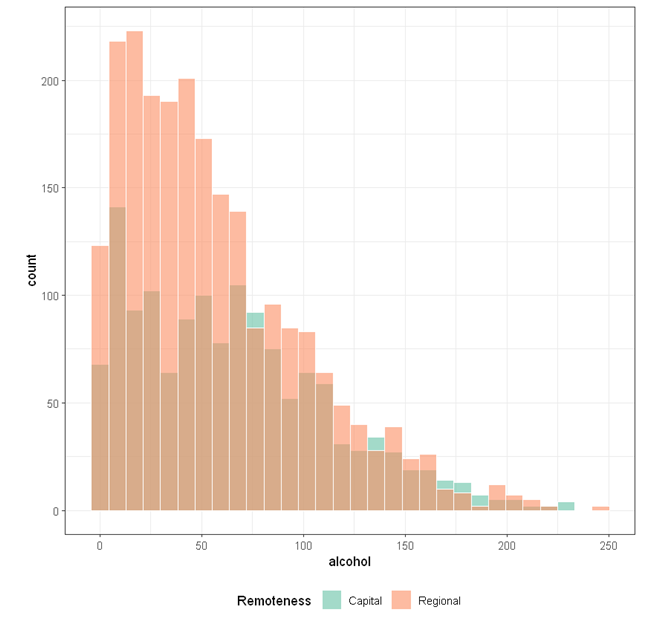
Numeric
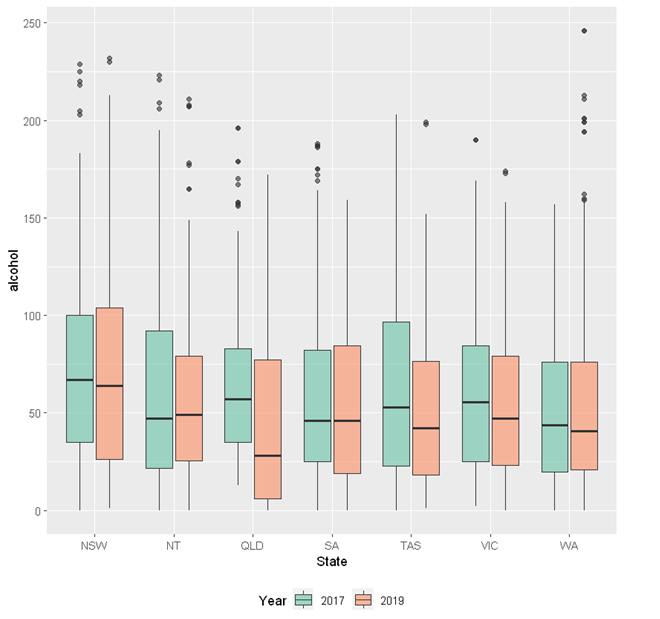
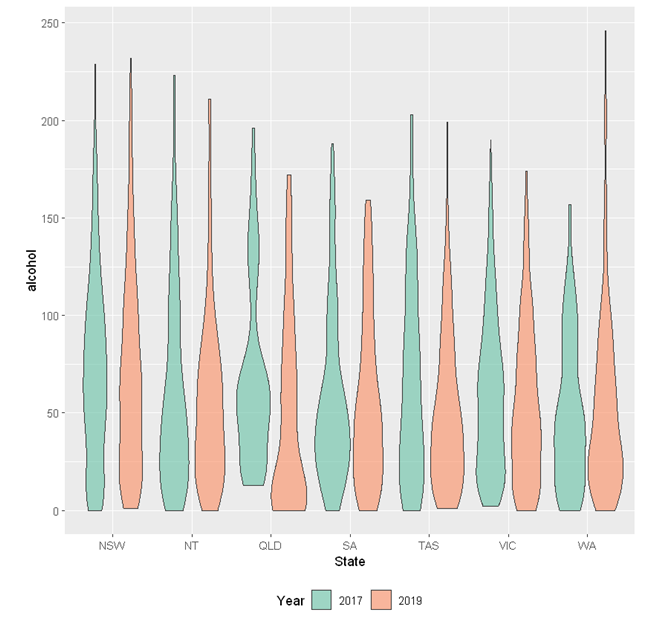
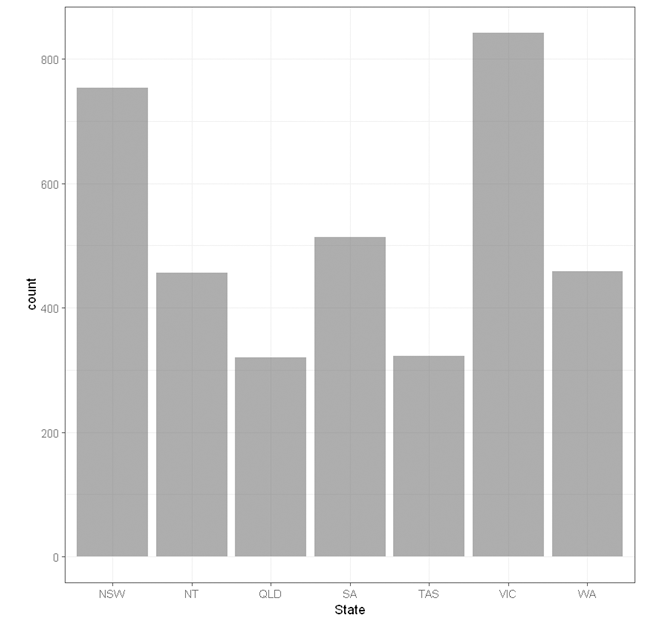
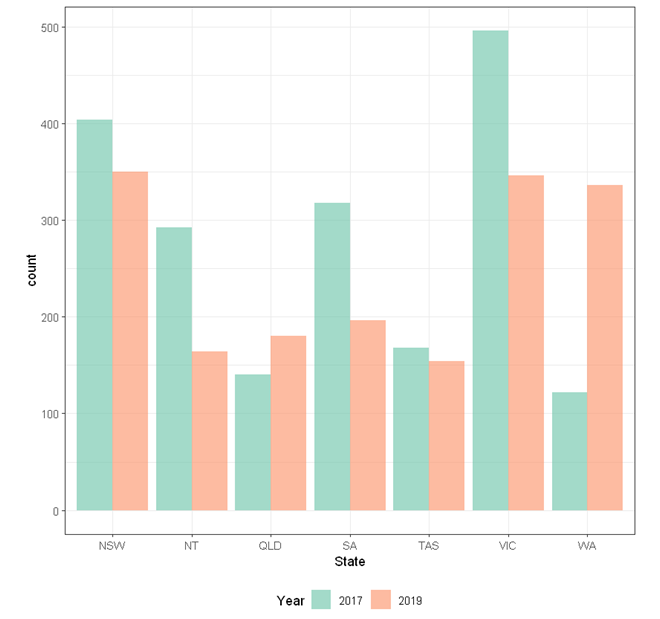
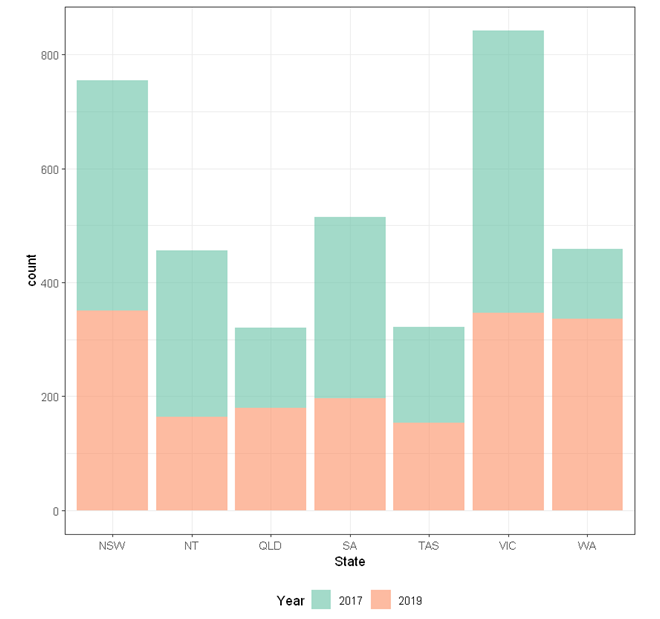
Categorical
Correlation
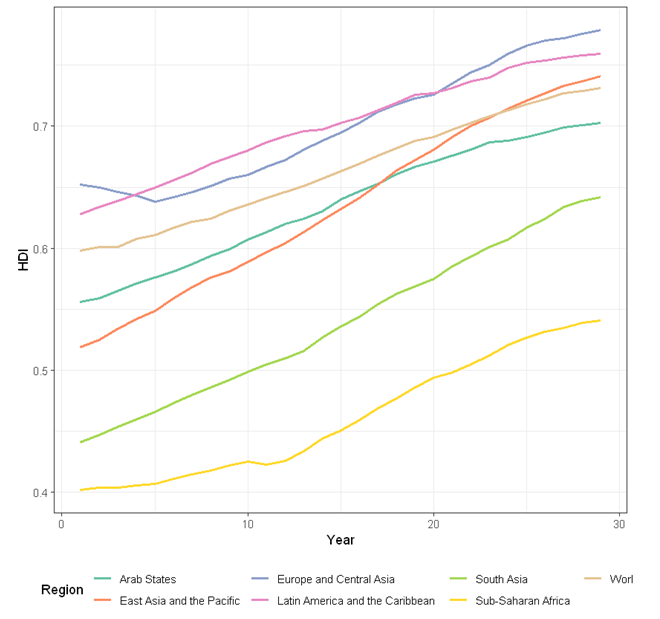
Line
World Map
Latest Post
26 Dec, 2020
Animated plots
The tutorial is based on R and StatsNotebook, a graphical interface for R.
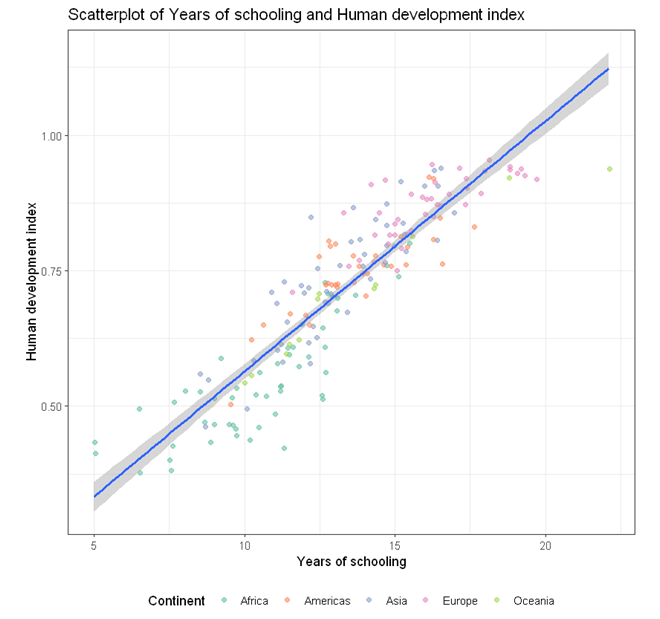
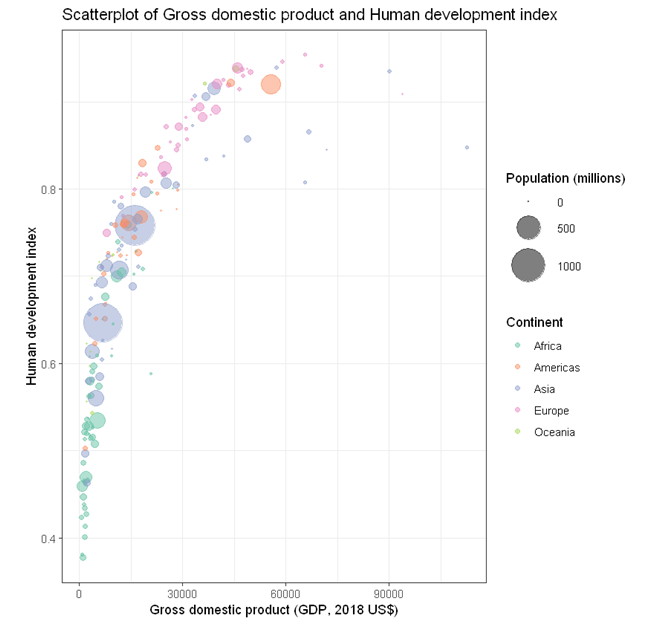
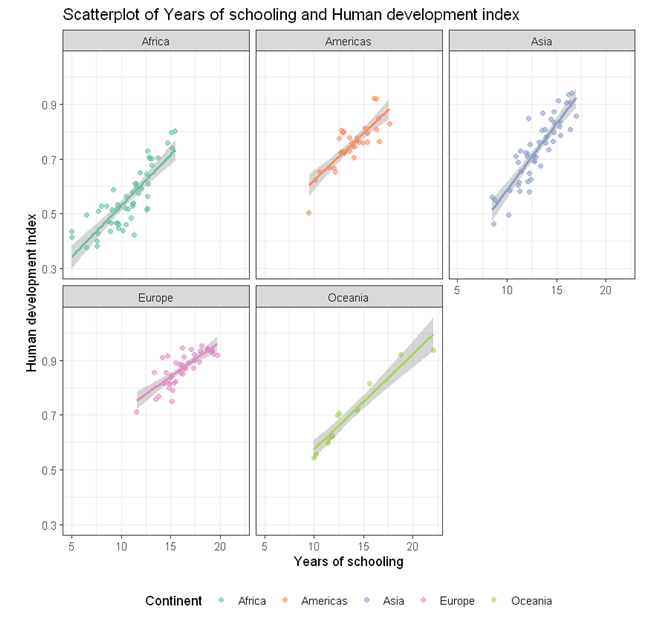
Animated plots can be created using the gganimate package, an extension of the ggplot2 package.
We will use the built-in Gapminder dataset for scatterplot example and the COVID-19 data for the line graph, world map and barchart. This dataset can be loaded into StatsNotebook using instruction here. The UNDP data can be downloaded from here here and the COVID-19 data can also be downloaded from here here .
Read more